Creating a WordPress Gutenberg block to display weather is now within everyone’s reach. This tutorial guides you to build a complete and flexible weather widget that integrates natively into the WordPress block editor.
Simplicity of Integration
Simply add the block to your pages or articles. No complex configuration required: select your city, choose the forecast period (24 hours or 7 days), and the block does the rest. Integration works perfectly on full pages or embedded in your custom templates, automatically adapting to your layout.
Display Modes
– Temperature graphs: Interactive curve visualization showing thermal evolution hour by hour or day by day
– Compact badges: Small box displaying temperature, conditions and weather icons for quick overview
– Detailed card: Complete view with humidity, wind speed, precipitation probability
Enable the EAC weather forecast block
The EAC components plugin is installed and active.
In the dashboard select EAC components link, select the WordPress tab and enable the Weather block option and save settings.
Enter the name of the city and country
In the block editor, search for the EAC Weather Forecast and drag and drop the icon into the preview panel.
In the Settings tab, Location section enter the city name in the City field then press Enter.
The widget will return the first city name it finds in its data. Optionally, if you want this city from another country, you can select the corresponding country from the Country list.
Configure the display type and its rendering
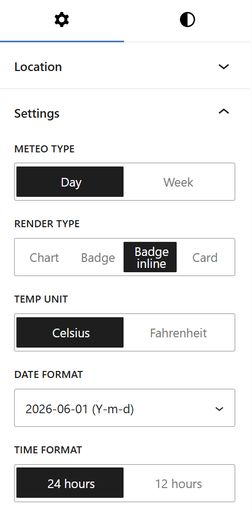
In the Settings tab, Settings section you can choose whether the weather data will be displayed as a daily or weekly chart.
The daily option allows you to display the weather data in a chart based on the city’s local time.
The data can also be displayed as a badge or a card.
Chart data can be displayed as a line, bar, or horizontal bar.
Select the temperature display unit, date format, and time: 24-hours or 12-hours (AM/PM).
Configure the content of the chart
The Content section is visible when rendering in a Chart; you can then select what will or will not be displayed in the Chart.
Configure styles
The content of the Color and Typography sections is contextual, depending on the rendering type: Chart or Badge/Card.
In the Style tab, Spacing section you will need to specify the top and bottom margins to be applied to the block, if applicable.
Configure the chart styles
Select the colour of the line(s) and the font size for the labels and data.
Configure the badge/card styles
Select from the palette the background and text colors, the default font sizes, and the font size applied to the city name and temperature.